
What the 2026 Stanford Search Fund Study says about Europe
The 2026 Stanford Search Fund Study is out, and most of the coverage has settled into the same pattern: quote the headline return, note that Europe is growing, conclude that search funds are a good asset class. Each of those points is defensible on its own. Stacked together without qualification, they mislead. This note sets out what the data actually supports, and where it leaves Europe.
The headline numbers, and what they cover
Stanford's Grousbeck-Holloway Center tracks 862 core search funds formed in the United States and Canada since 1984, with data through 31 December 2025. That is roughly 99% of the known universe in those two countries.
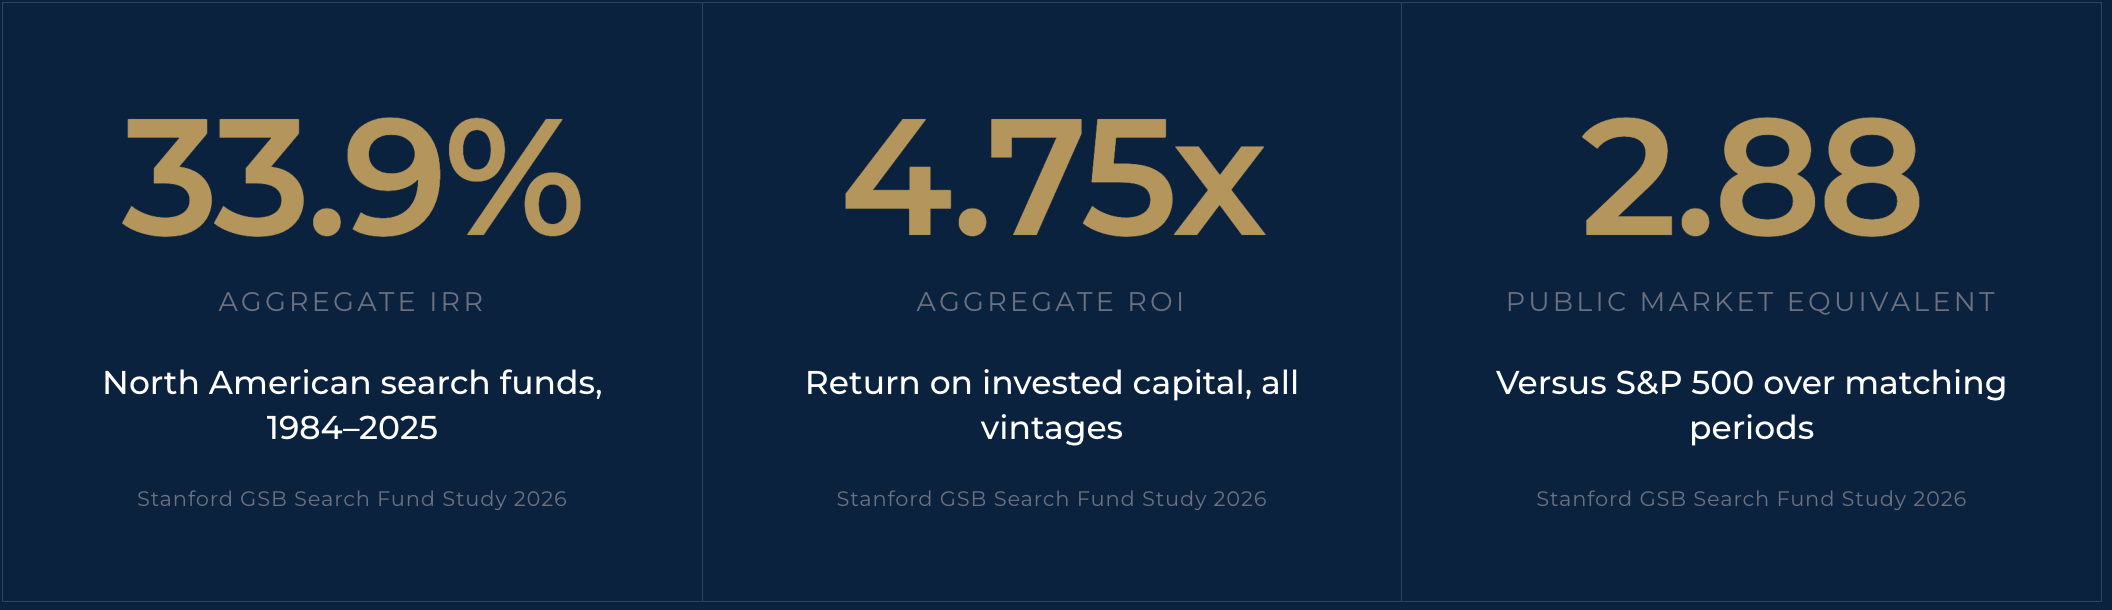
As of that date: an aggregate IRR of 33.9% and a 4.75x ROI. Funds that have exited did better, at approximately 39.3% IRR and 5.98x. Against public markets, the aggregate public market equivalent is 2.88, meaning the same cash flows in the S&P 500 over the same periods would have returned less than a third as much.
Those are strong numbers and they have been durable across four decades and several cycles. They are also North American numbers, drawn from a North American dataset. Stanford says so explicitly. It is worth repeating because a lot of the commentary quietly drops it.
The European number is a different number
The benchmark outside the US and Canada is IESE's International Search Fund Study, undertaken in close partnership with Stanford Graduate School of Business. The current edition is the seventh, published in 2024, with data through 31 December 2023. It covers 320 search funds across 40 countries.
Aggregate IRR: 18.1%. Aggregate MOIC: 2.0x. The median international fund returned 1.4x. The top performer returned 31.4x.
Note the dates before you put the two side by side. Stanford's cut is end-2025. IESE's is end-2023. There is no 2026 international edition. Anyone quoting a current European return figure is quoting data that is two years older than the North American figure they are quoting it against.
That gap is large and it deserves an honest explanation rather than a footnote. IESE's own reading is that the international book is young: 62% of international acquisitions had happened since 2020, which leaves very little time for equity appreciation to show up in the numbers. Holding periods in this model run five to ten years, and equity appreciation is most often reported as greatest after year three or four. Most international companies simply have not got there yet. There have been only 21 exits outside the US and Canada, 15 positive and six failures.
The scale of the understatement is visible in Stanford's own 2026 edition, which puts the international universe at 503 funds and 220 acquisitions. The book is more than half again as large as the returns data reflects, and it is barely realised.
Some of that gap will close as the vintages mature. Some of it will not, because the structural differences do not disappear with time. Thinner financing infrastructure, fragmented broker networks and country-by-country debt schemes are features of the market, not phases of it.
The acquisition rate is the real finding
If there is one line of the 2026 study worth reading, it is this one.
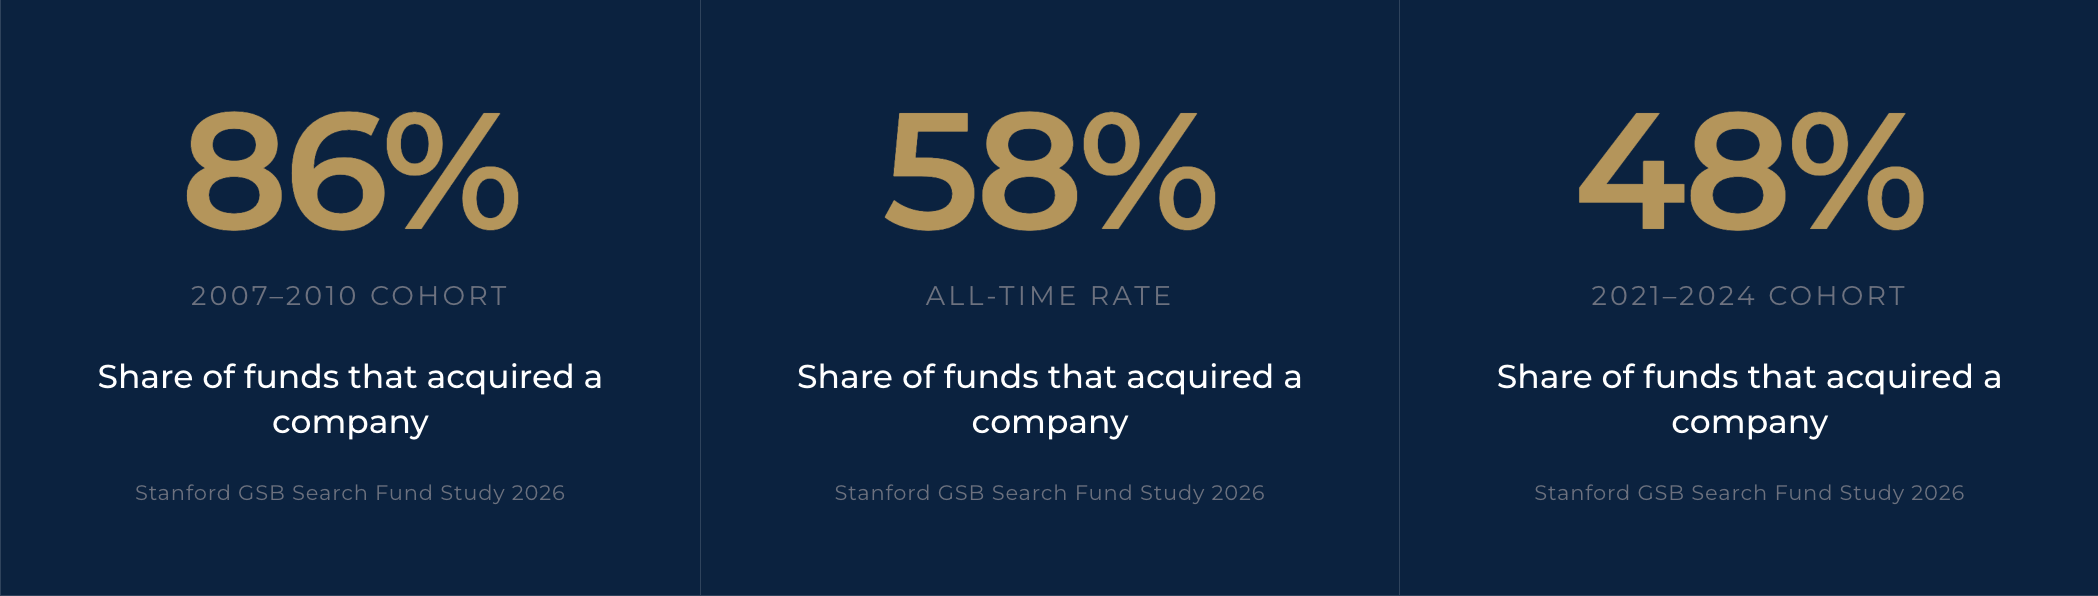
The all-time acquisition rate is 58%. For funds launched between 2021 and 2024, it is roughly 48%. For the 2007 to 2010 cohort, it was 86%.
Stanford attributes about half of the recent decline to tougher market conditions and increased competition, and about half to a wider range of preparedness as the model has gone mainstream.
That second half is the operative one. It is not a market fact. It is a selection and support fact, and it is the part anyone running a platform can actually do something about.
One counterweight worth putting on the table, because it cuts against the direction of this piece. IESE reports that 79% of international search funds had acquired a company by 2023, against the 63% it cites for the US and Canada. Younger book, different universe, self-reported. But it does not support the assumption that Europe is the harder place to get a deal done.
Prices have followed the competition
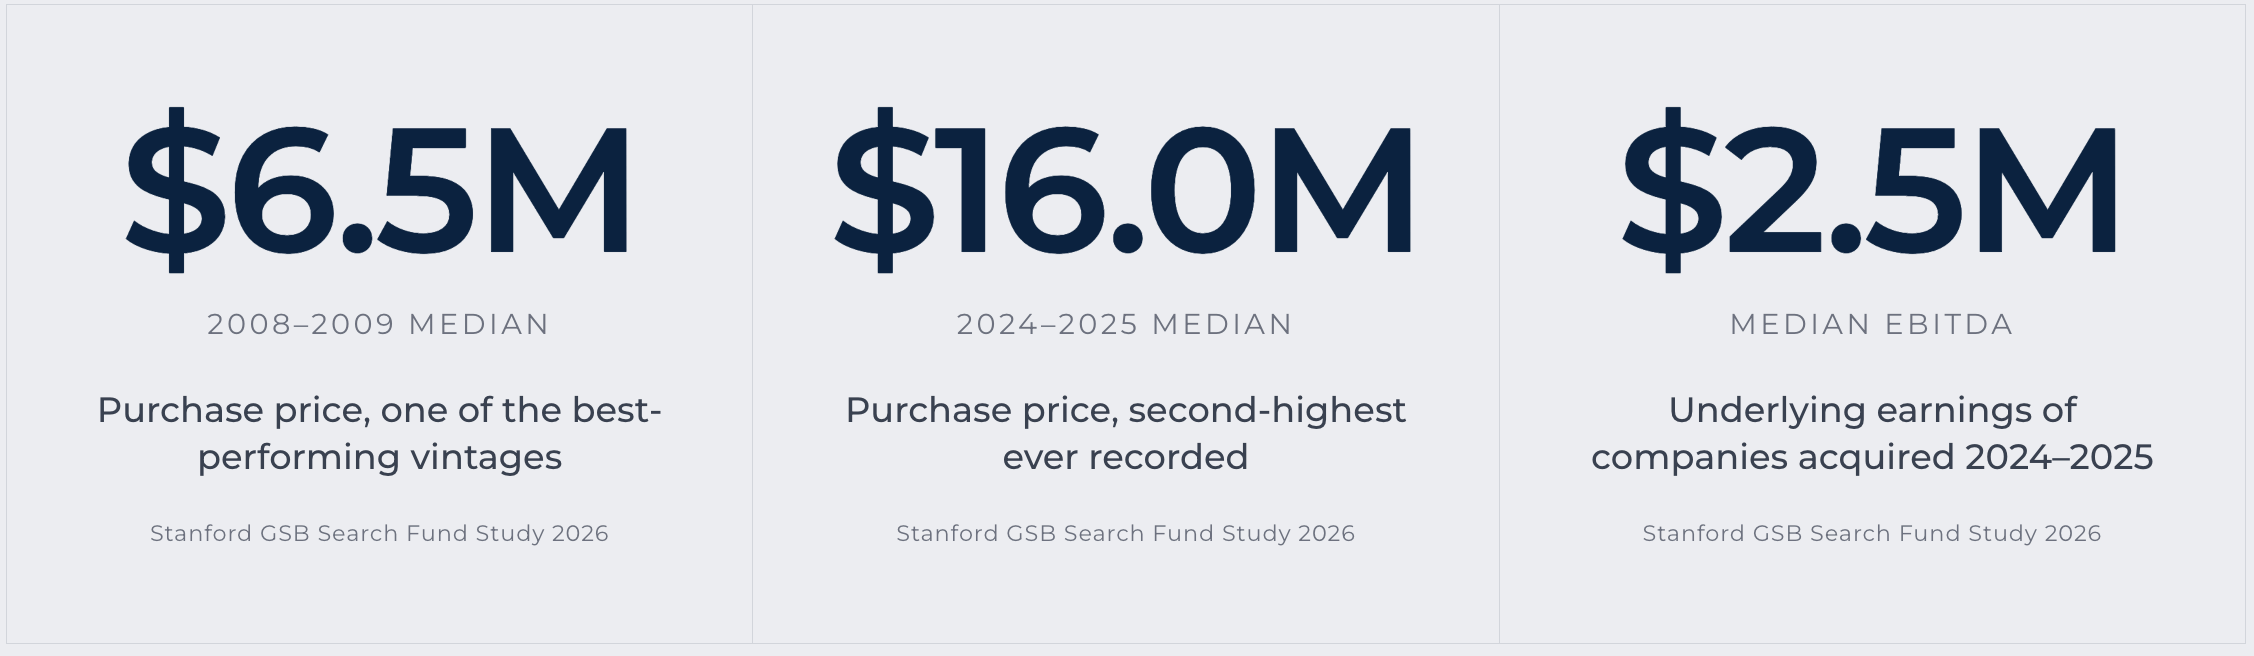
The median company acquired in 2024 and 2025 sold for $16.0 million on about $2.5 million of EBITDA, at roughly 6.2x, with a 25% margin and around 30 employees. That is the second-highest median purchase price ever recorded. The median across all acquisitions since inception is $13.5 million.
The 2008 to 2009 cohort, one of the best-performing vintages in the study's history, bought at a median of $6.5 million.
All figures in US dollars, as both studies report them.
You cannot buy 2009 assets at 2025 prices and expect 2009 outcomes. Entry price is the one variable that is fully decided before any operating work begins, and it is the one that competition erodes first.
The average is not the outcome
Search fund returns follow a power law, and the 2026 study is unusually direct about it.
Strip out the funds that returned 10x or more and the aggregate ROI falls from 4.75x to about 2.8x. Remove the top 10% of funds and it drops to 2.1x.
The pattern repeats at the operator level. Among CEOs who have exited, 22% earned $10 million or more. Another 22% earned nothing. The distribution is U-shaped and it is getting more pronounced.
The conclusion is not that returns are falling. It is that "invest in search" was never a strategy. Selection is the strategy: which operators, which cap tables, which geographies, at which price.
Europe is not one market, and the data shows it
Stanford identified 190 new international search funds launched in 2024 and 2025 alone, and a large share of that is European. But European activity is not evenly spread, and the unevenness is the whole point.
Spain is the most active search fund market in Europe, with 67 funds tracked by IESE, followed by the UK in the mid-thirties. Those markets have established investor bases, dedicated conferences and functioning broker infrastructure. Spain has an IESE-anchored ecosystem and accessible public databases on family business succession. Germany has the largest succession market on the continent and, remarkably, no central database at all.
Then there is the tier that barely registers. Belgium appears in IESE's data for the first time in 2021, one of nine countries to record a first search fund that year. The Netherlands appears for the first time in 2023. There is a very small number of dedicated regional vehicles, and the thin institutional investor base is a large part of why many Dutch searchers have chosen the self-funded route instead, which also gives them more equity and more flexibility on the lower-EBITDA targets common in that market.
This is why "Europe is growing" is close to a meaningless sentence. Madrid and Antwerp are not at the same point on the same curve, and an investor treating them as one market is making the same category error as an investor treating Stanford's 33.9% as a European number.
You can read the early markets two ways, and both are correct.
They are underdeveloped: less capital, less infrastructure, fewer proven exits to point at.
They are also uncontested. The competition that pushed North American acquisition rates from 86% to 48%, and median entry prices from $6.5 million to $16.0 million, has not arrived with the same force. SMEs in the €1 to €5 million EBITDA range still trade at multiples that would look like a mispricing in Madrid or London.
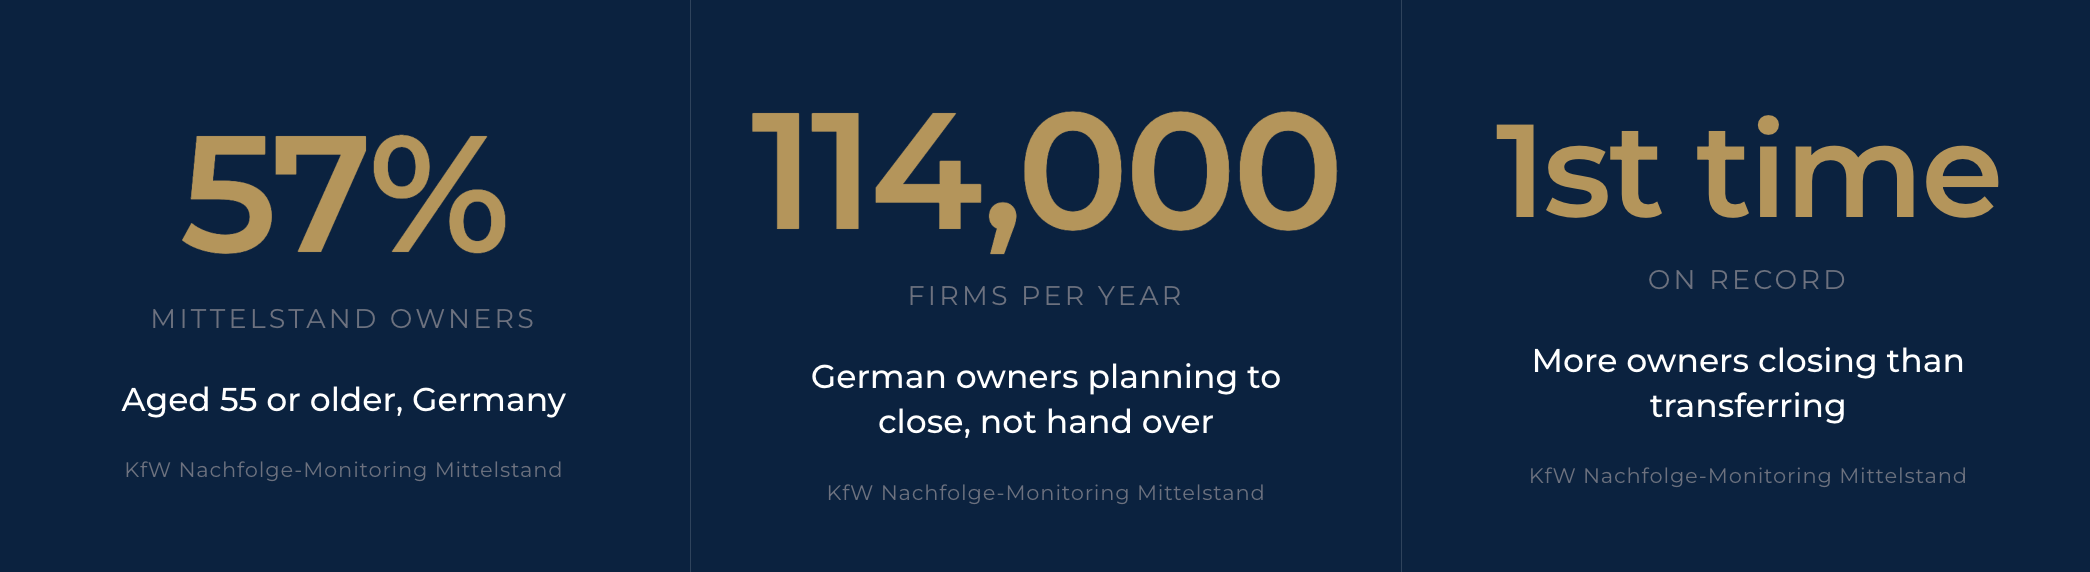
A note of caution on the demand side, because this is where most European search commentary stops being rigorous. Germany has authoritative data: KfW's Nachfolge-Monitoring reports 57% of Mittelstand owners aged 55 or older and, for the first time on record, more owners planning to close than to hand over, at roughly 114,000 firms a year. Belgium and the Netherlands have nothing comparable. What exists is broker and advisor estimates putting roughly 30% to 35% of active owners at or near retirement age, with manufacturing, construction and transport skewing older.
There is no point dressing up an estimate as a certainty. The demographic direction is not seriously disputed and the owners are visibly there. But the absence of an authoritative national tracker is itself part of the point. These are markets where the infrastructure that makes an opportunity legible has not been built yet, which is the same reason the entry prices have not moved.
What WAD Capital takes from this
A necessary caveat first. Stanford and IESE count core search funds only. They explicitly exclude self-funded searches, single-investor deals, accelerator models and entrepreneur-in-residence arrangements. WAD Capital’s CEO-in-Residence model falls into that excluded category.
What it does measure is the model WAD Capital deliberately built away from. Its documented failure modes map almost exactly onto the reasons the firm is structured the way it is. The 2026 edition is more useful than previous editions, because for the first time it quantifies them.
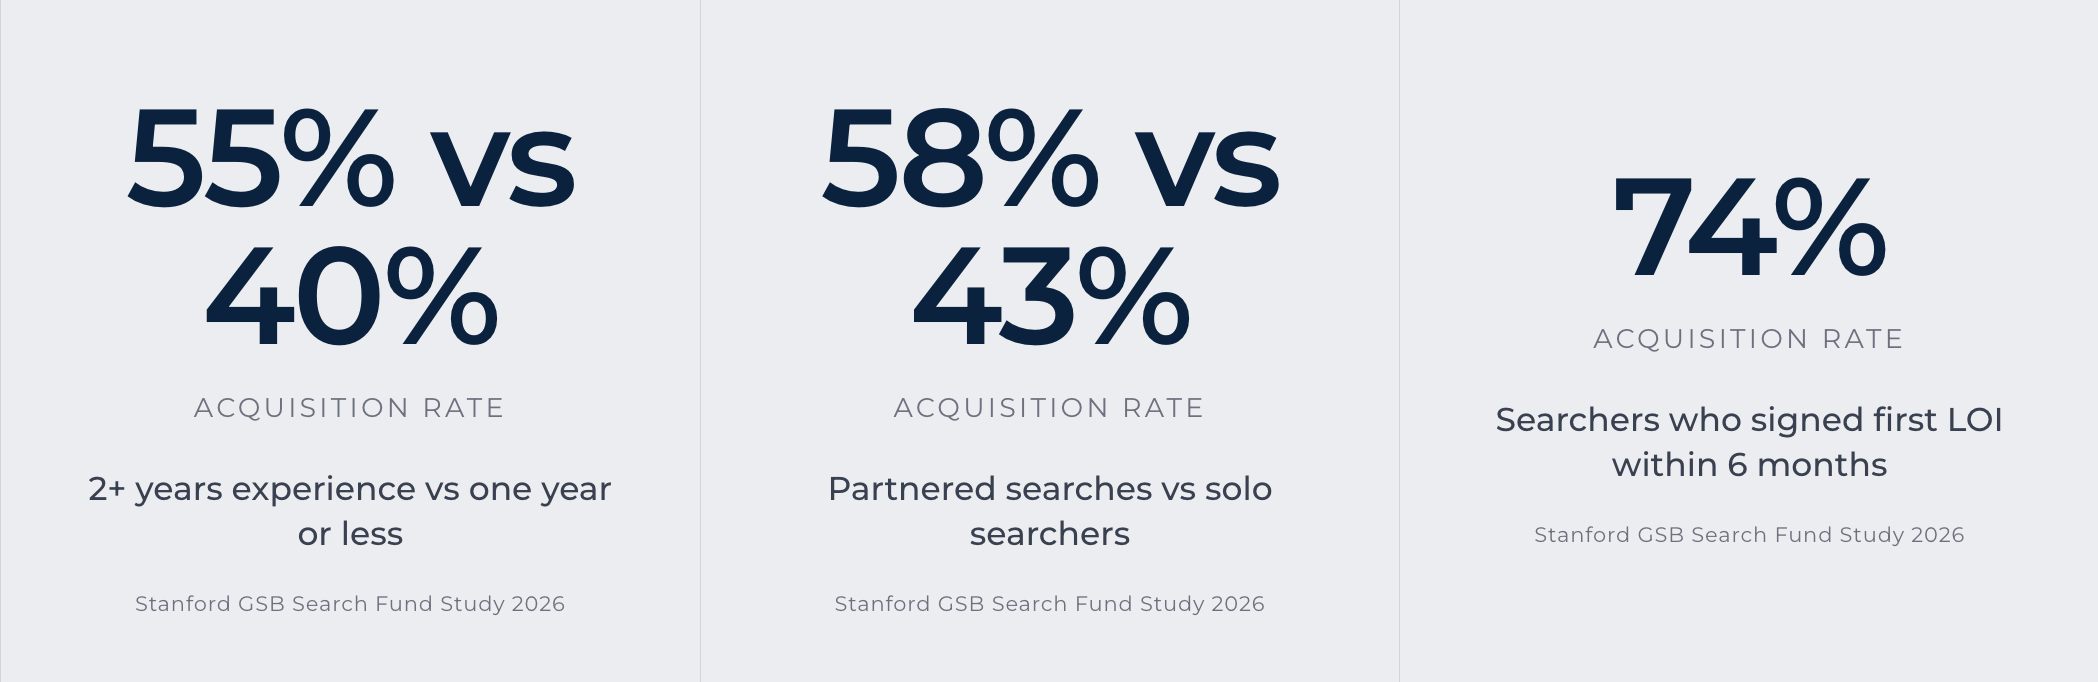
Preparedness dispersion. Stanford names a widening range of searcher preparedness as roughly half the reason acquisition rates have fallen, and it now says which parts of preparedness matter. Searchers with more than two years of post-graduation experience acquired at 55%, against 40% for those with a year or less. Partnered searches acquired at 58%, against 43% for solo. The median searcher in the recent cohort is 32 years old and around 80% hold an MBA. WAD Capital places experienced operators as CEOs-in-Residence, not first-time searchers two years out of business school. That is a narrower funnel and a slower one, and it is the direct answer to the variable the data says is moving.
The investor base is itself a failure mode. Stanford asked searchers why deals died. Diligence findings first, valuation gaps second, lack of investor support third, and among searchers who acquired in 2024 and 2025, 40% cited lack of investor support as a reason an earlier letter of intent failed. In a syndicate, every deal is re-underwritten by fifteen or so people who each hold an effective veto, at the worst possible moment, with no obligation to explain themselves. Committed capital with one investment committee removes that failure mode outright. This is not a marginal efficiency. It is one of the three named reasons searches fail, and it is structural rather than behavioural.
Momentum is measurable, and origination decides it. Searchers who signed a first letter of intent within six months went on to acquire 74% of the time. Within twelve months, 65%. Past that, the odds turn against them. Successful searchers in 2024 and 2025 signed an average of 2.5 LOIs, the first at around month seven. Stanford's guidance on how to generate that momentum assumes American sourcing infrastructure: large intermediary associations, a central searcher platform, dense broker networks. Europe has none of that at comparable scale. Belgium runs largely through Transeo, the Netherlands through Brookz and DealSuite, Germany through a fragmented mix of government, commercial and chamber exchanges with no central spine, and a substantial share of every one of those markets never lists anywhere. Centralised, systematic origination is not a nice-to-have here. It is what determines whether a search concludes at all.
Entry discipline. Operating in a market that has not been bid up is worth more than any post-close value creation plan. It is also perishable. Spain was uncontested once too.
One more observation, because it complicates the easy story about Europe being behind. IESE reports partnerships at 40% of international funds against 19% in the US and Canada. Europe already does, at more than twice the rate, the thing Stanford's own data says most improves the odds of acquiring. The European deficit is in capital and infrastructure, not in how the searches are staffed.
There is no forty-year track record to point to. What exists is a model designed against a documented set of failure modes. Nobody in Europe does, and any European manager telling you otherwise is quoting Stanford's.
The unit of analysis has changed
Stanford has settled whether search funds work as an asset class. The evidence is four decades deep and it is not seriously contested.
What the 2026 edition shows is that the asset class is no longer the useful unit of analysis. When 58% of funds acquired, the category average told you something. At 48%, with a U-shaped operator distribution and entry prices at near-record highs, the average tells you almost nothing about any individual outcome. Two funds raised in the same year, in the same country, on the same terms now sit at opposite ends of the distribution, and the study is fairly clear that experience, partnership, early momentum and investor support explain a meaningful share of which end they land on.
That is a harder market to be a passive allocator in, and a better one to be an operator in.
For Europe specifically, it means the interesting question is no longer whether the model travels. It clearly does. The question is whether the markets that are still early build the investor base, the sourcing infrastructure and the operator pipeline before competition compresses entry prices to where they already are in Madrid and Boston.
If the distribution is set by operator quality and by whether capital shows up at the close, then both have to be underwritten before the deal rather than discovered after it. Neither is solvable one country at a time. Origination is irreducibly local, because the networks and the platforms are national and a large part of the market never lists anywhere. Capital is not local at all, and a syndicate assembled per deal is precisely the veto Stanford found killing two in five failed deals. What that implies is a platform: operators embedded in each market, one committed capital base behind them, one investment committee.
That is the part of the model Europe still gets to build differently, because it is early enough to choose.
WAD Capital is building it in Europe, starting in Benelux, because that is where we are from and because it is the least contested market on the continent. The choice of where to start is not the same as the scope of the thing being built.
The full 2026 Search Fund Study is published by the Grousbeck-Holloway Center for Entrepreneurial Studies at Stanford Graduate School of Business and is available at no charge. International figures are from IESE Business School's 2024 International Search Fund Study, the current edition, with data through 31 December 2023. Where the two studies are quoted side by side, the two-year difference in reporting date applies. Succession estimates for Belgium and the Netherlands are advisor and broker estimates, not official statistics.
Sources: Stanford GSB 2026 Search Fund Study and IESE International Search Fund Study 2024.
